Voice of the Customer: Web Application and API Protection, Gartner Peer Insights
What is API and Web Application Protection?
Web application and API protection (WAAP), according to Gartner, is the evolution of the web application firewall (WAF) market, which now includes four core features in addition to WAF: distributed denial of service (DDoS) defence, bot management, and API defence. Beginning with cloud-delivered WAF services that were simpler to implement, WAAP development initially combined WAF with DDoS defence. The WAF market gradually developed to provide more features for bot management and API protection than the bare minimum. The acquisition of specialised bot mitigation providers by four vendors in 2019 signalled a tipping point. Gartner noted improvements in the availability of API security features in 2020, as well as stricter enterprise requirements for the four core WAAP features.
What Is “Voice of the Customer” from Gartner Peer Insights?
The “Voice of the Customer” is a document that distils information for IT decision-makers from Gartner Peer Insights reviews. As it focuses on first-hand peer experiences of implementing and using a solution, this aggregated peer perspective, along with the individual detailed reviews, is complementary to Gartner expert research and can be a crucial part of your purchasing decision. Only vendors with 20 or more eligible published reviews over the course of the designated 18-month submission period are listed in this document. Reviews from customers of businesses with less than $50 million in revenue are not taken into account in this methodology. View the “Voice of the Customer” methodology in its entirety here.
The WAAP market is covered by a related expert-led Magic Quadrant from Gartner in addition to the historical peer-based perspective presented in this document. Visit the Magic Quadrant for Web Application and API Protection for related market research.
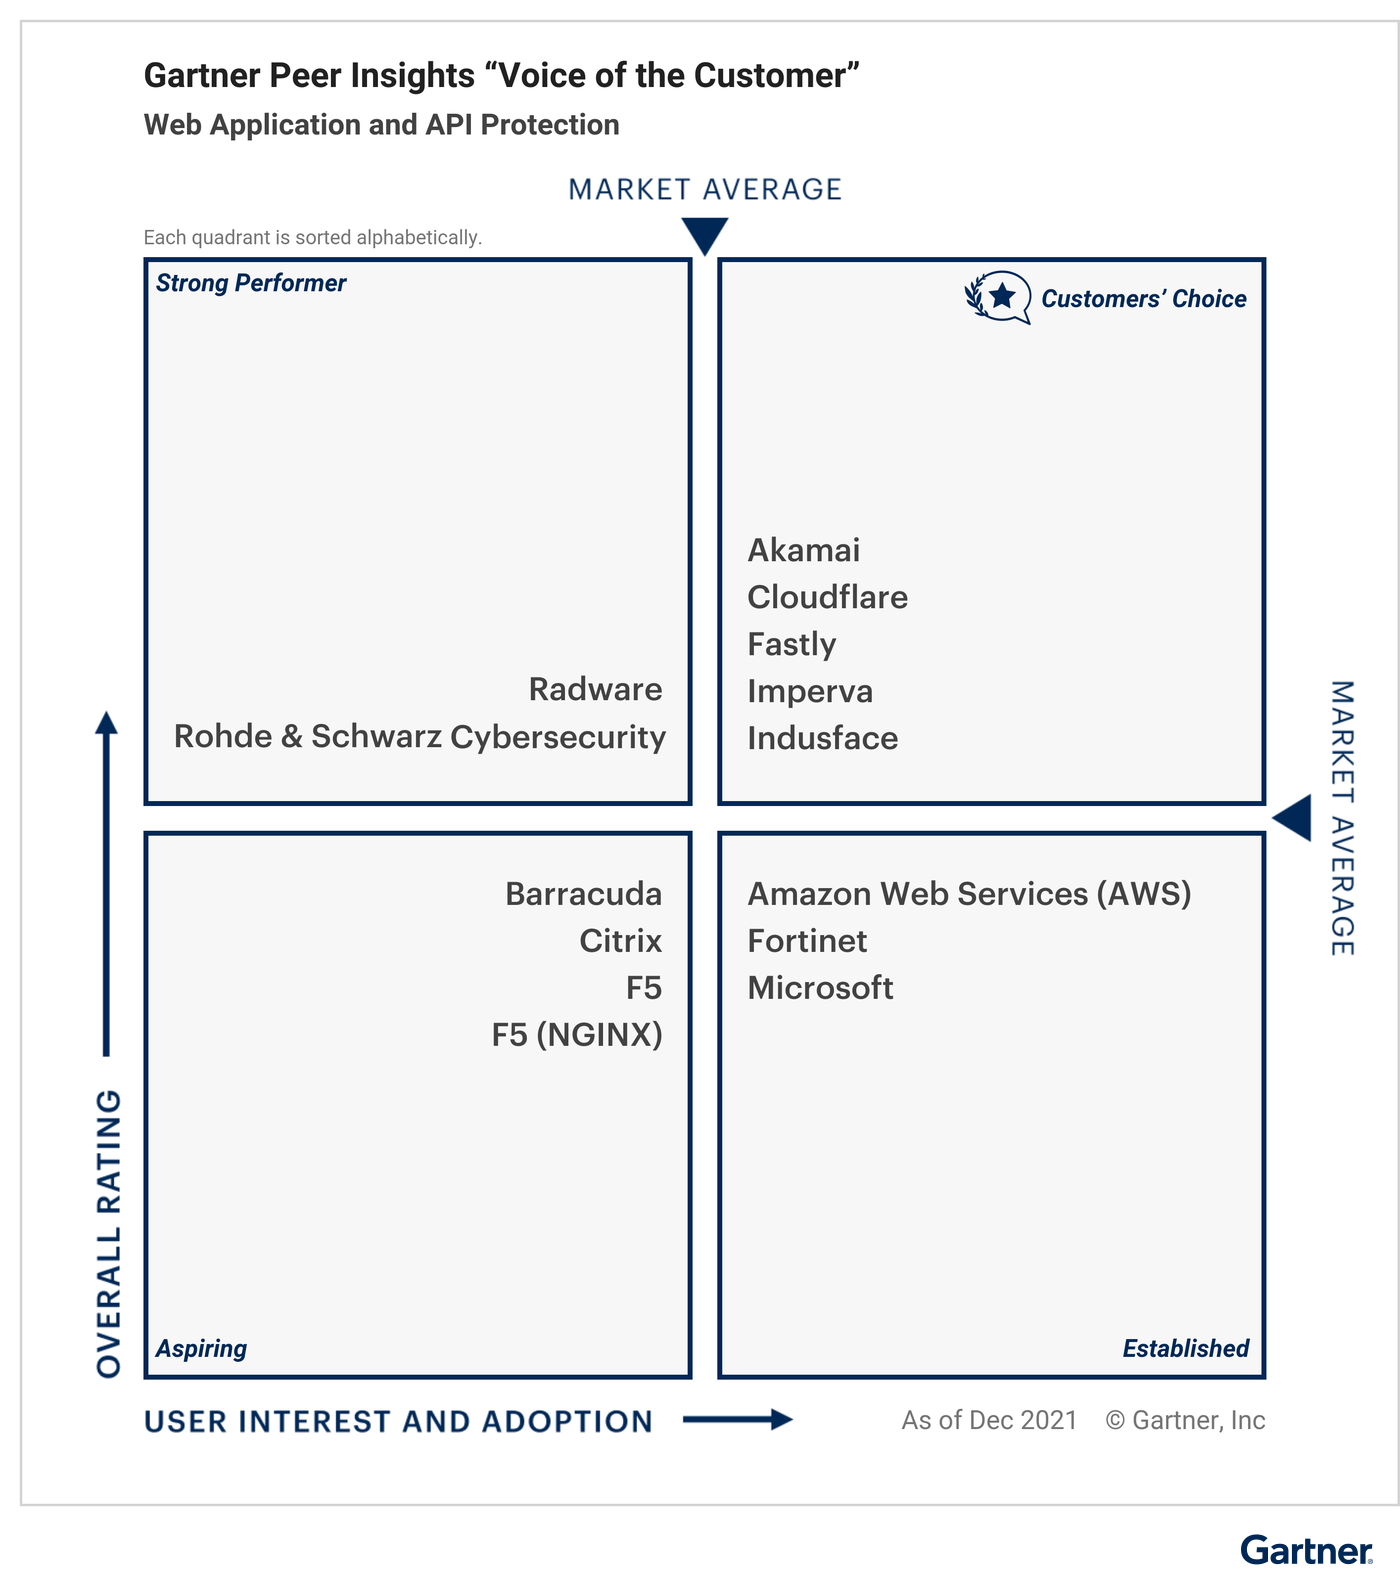
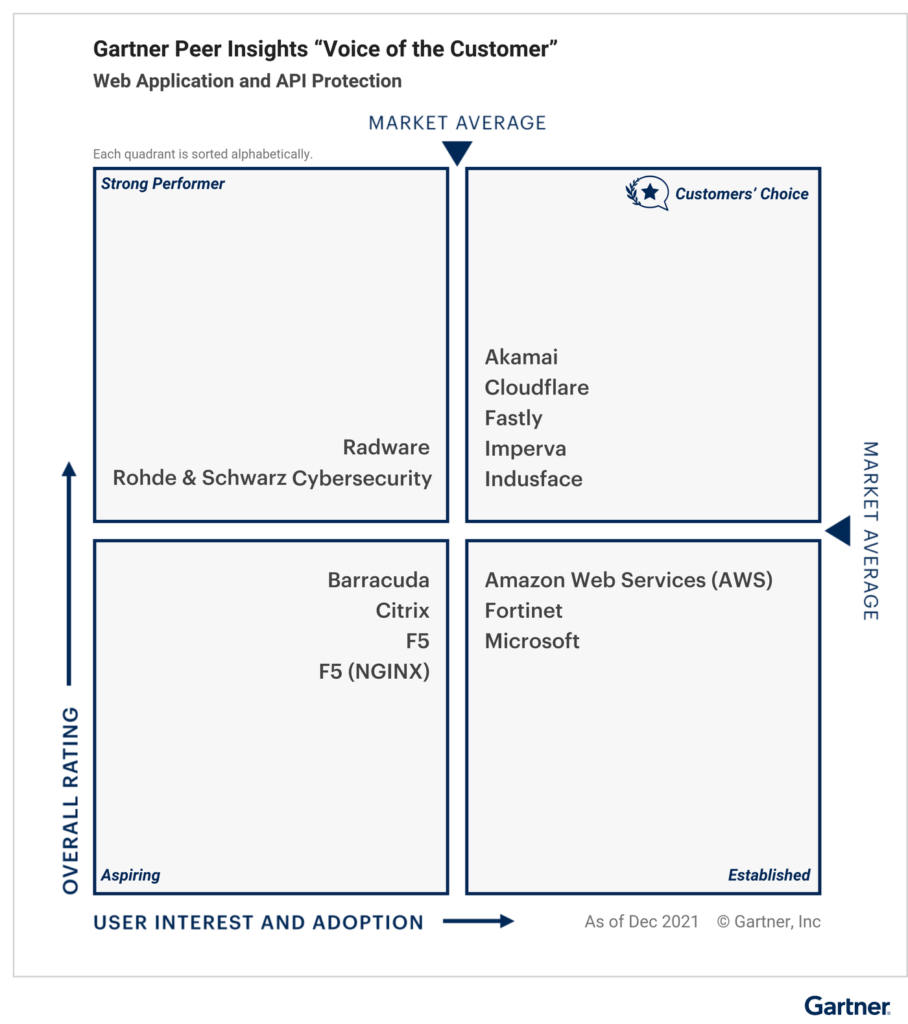
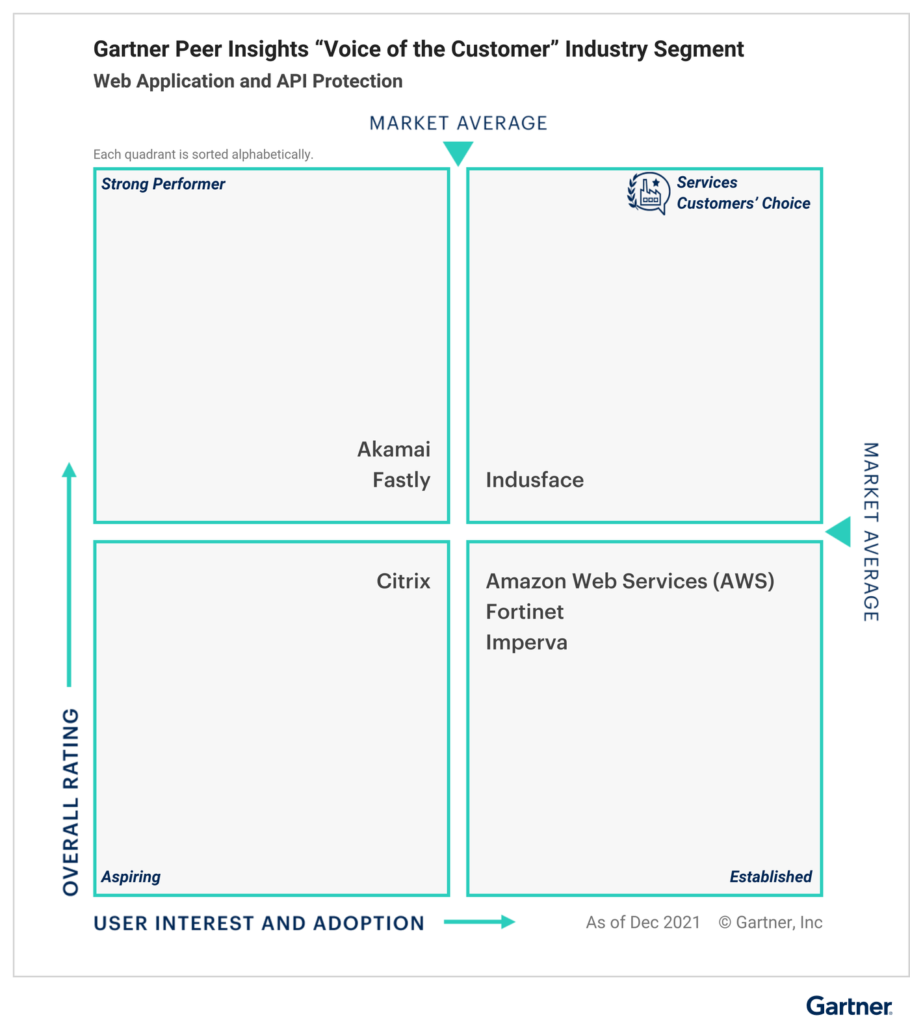
In the 18 months leading up to the end of December 2021, Gartner Peer Insights published 1,504 reviews and ratings in the WAAP market. Figure 1 displays the user interest and adoption (X-axis) and overall rating (Y-axis) categories for all eligible vendors into four quadrants (Y-axis). Vendors are listed alphabetically within each quadrant.
Three factors—review volume, user willingness to recommend, and review market coverage across industry, company size, and deployment region—are combined to determine a vendor’s User Interest and Adoption score. Each factor is given one-third of the total weight.
For a vendor to be eligible for the right-hand quadrants, they must achieve or surpass the market average User Interest and Adoption Score.
The mean of the average Overall Ratings of all eligible vendors constitutes the market average. In order to be positioned in the upper quadrants, vendors must achieve or surpass the market average Overall Rating.
Each quadrant is labelled as described below for clarity’s sake. See the full methodology here for details on how to assess vendors in each quadrant of the “Voice of the Customer” graphic.
The Gartner Peer Insights Customers’ Choice distinction, indicated by a Customers’ Choice badge, is given to vendors who are positioned in the upper-right quadrant of the “Voice of the Customer” quadrants.
Both the market average Overall Rating and the market average User Interest and Adoption are met or surpassed by the recognised vendors.
Market averages for User Interest and Adoption are met or exceeded by vendors listed in the lower-right “Established” quadrant of the “Voice of the Customer,” but market averages for Overall Rating are not.
The vendors listed in the upper-left “Strong Performer” quadrant of the “Voice of the Customer” meet or exceed the market average in terms of Overall Rating, but fall short in terms of User Interest and Adoption.
Both the market average for User Interest and Adoption as well as the market average for Overall Rating are not met by vendors listed in the lower-left “Aspiring” quadrant of the “Voice of the Customer.” Their products are in line with this market, just like those of all the vendors in this report, and they have satisfied the requirements to be listed.
Protection for APIs and web applications Peer Evaluations and Scores
By clicking here, you can read individual reviews and ratings on Gartner Peer Insights in addition to the summary offered by the “Voice of the Customer.”
The remaining sections of this document will highlight some important findings for the WAAP market based on 18 months of reviews and suggest specific applications for the site in the purchasing process.
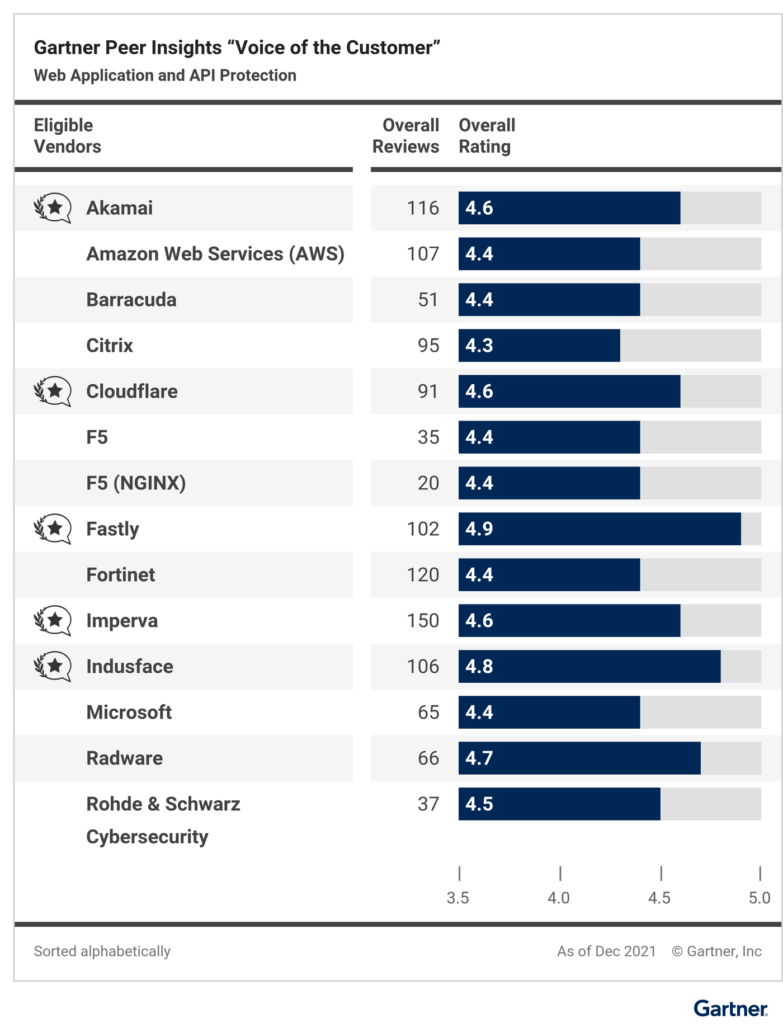
Figure 2 lists, alphabetically, the Overall Ratings (out of 5 stars) for vendors in the WAAP market who have obtained more than 20 reviews that qualify during the 18-month period ending on December 31, 2021. The overall rating serves as a gauge of how pleased current clients are with a vendor’s offering.
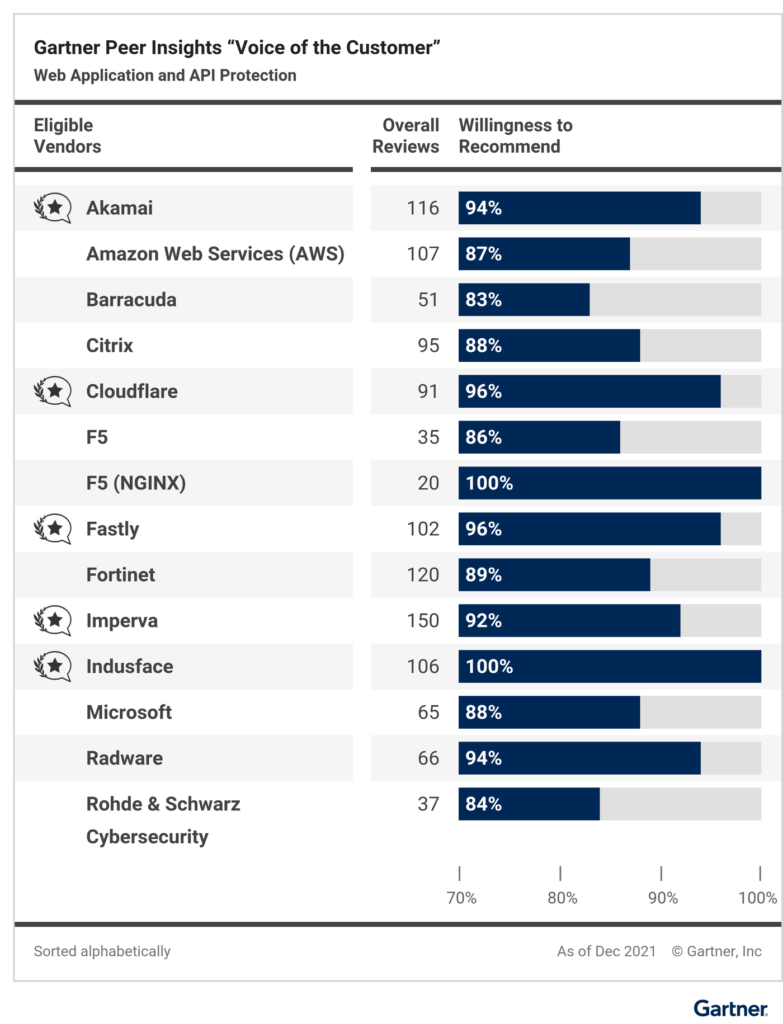
Gartner Peer Insights reviews offer information on end users’ propensity to recommend each vendor in addition to the Overall Ratings. One element of the “Voice of the Customer” X-axis is willingness to recommend. For more information, see the methodology. The percentage of reviewers who were willing to recommend each vendor is shown in Figure 3 (for more information, see the “Methodology” section). Please click here to go to the Peer Insights market page and select the “Compare Alternatives” button under the vendor or product you are interested in to create a more thorough comparison between the vendors on your shortlist.
Segment titled “Voice of the Customer” View
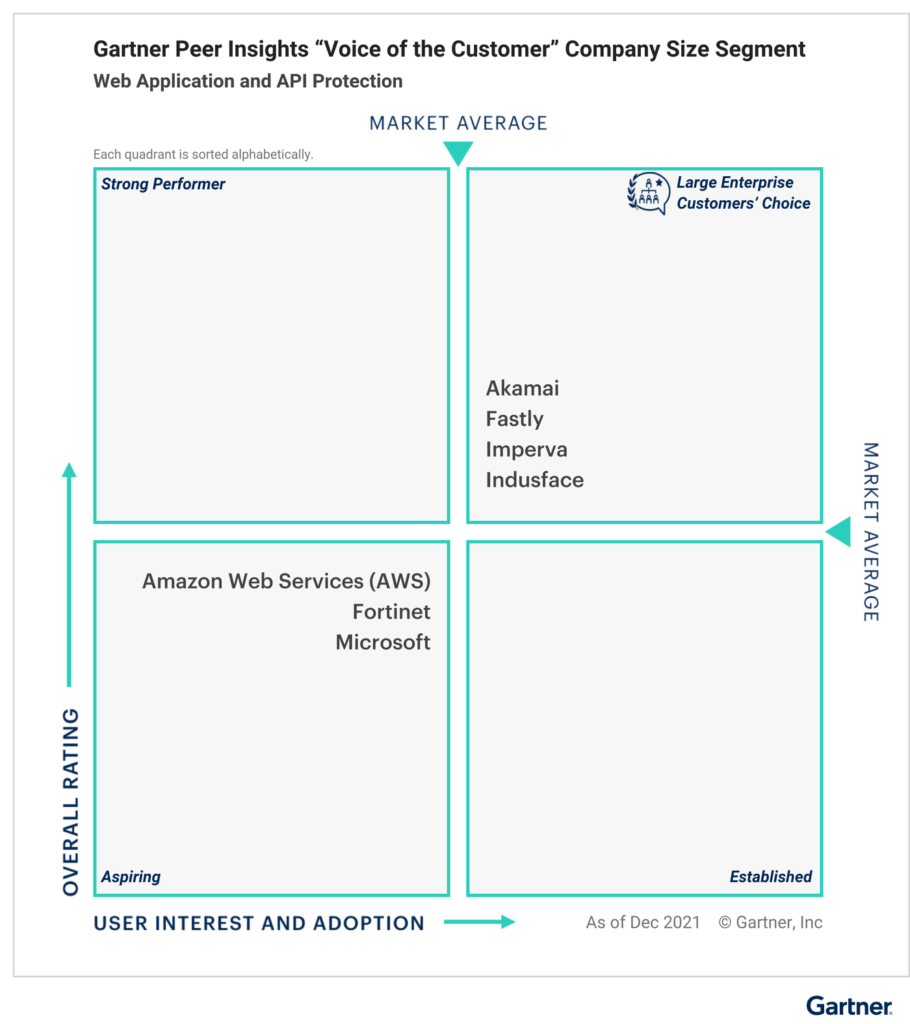
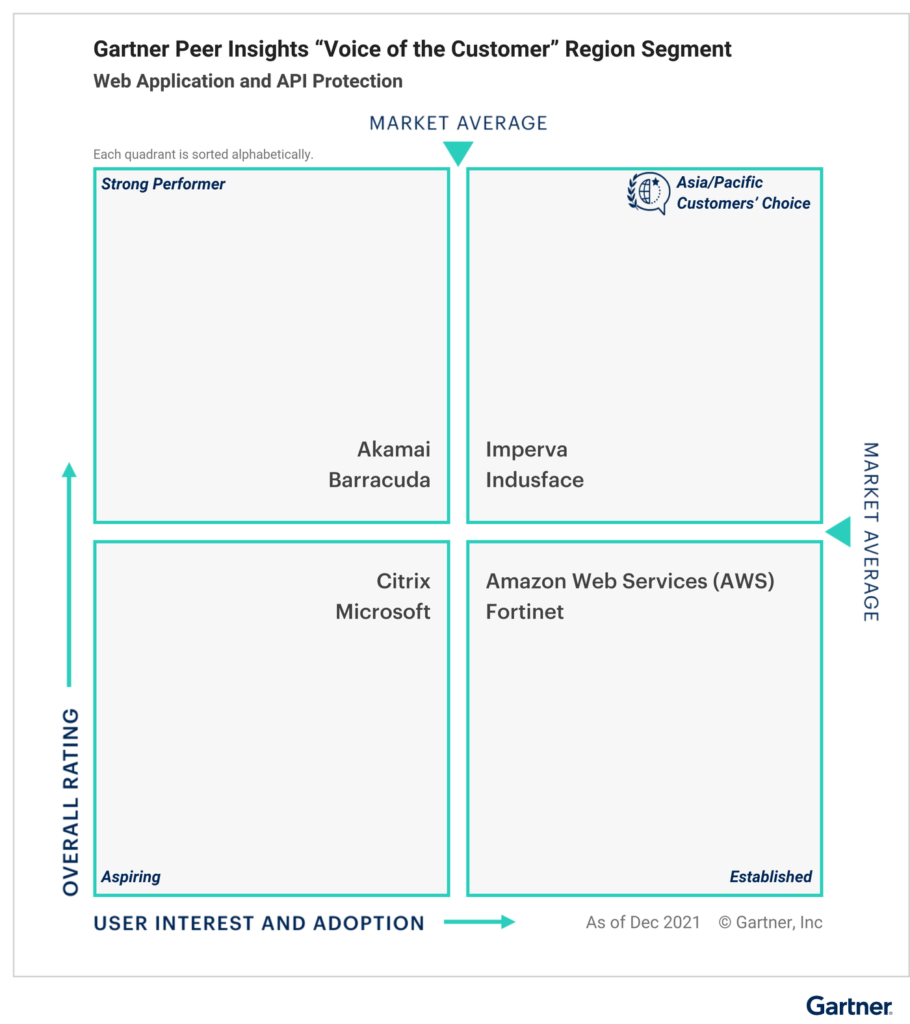
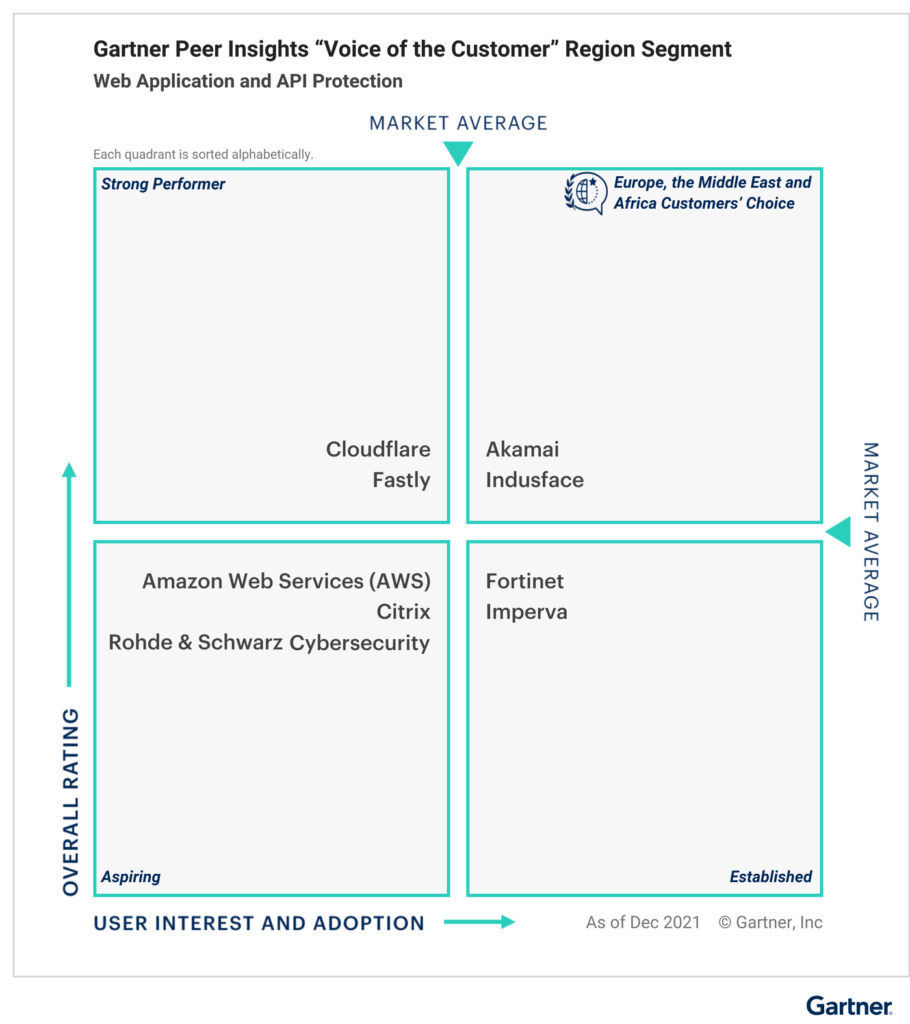
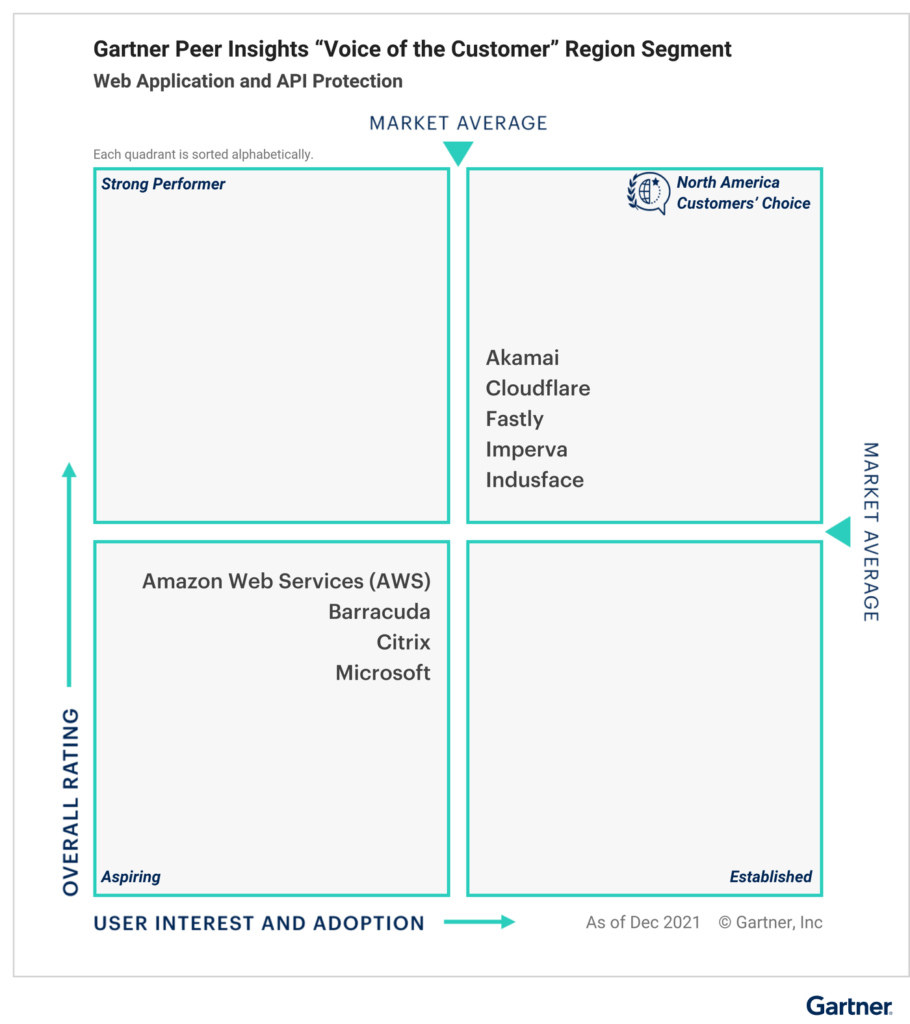
Based on the characteristics of their reviewers, Figures 4 through 9 group market vendors into distinct customer segments by industry, deployment region, or company size. This data is gathered by Gartner Peer Insights from user reviews and account profiles. Only those vendors are included who had 20 or more eligible reviews in the segment during the 18-month review period. Vendors are positioned for each segment according to User Interest and Adoption on the X-axis and the market average Overall Rating on the Y-axis. Review count score and willingness to recommend are two factors (each weighted 50%) that go into determining user interest and adoption. Calculations for both axes only take into account reviews from reviewers who are part of the segment.
The calculation does not take into account review market coverage because each graph only refers to one specific segment.
For a vendor to be eligible for the right-hand quadrants, they must achieve or surpass the segment’s average User Interest and Adoption Score. In order to be positioned in the upper quadrants, a vendor must meet or surpass the segment’s average Overall Rating. Only reviews from the segment for vendors shown on the graph are used to calculate the averages for both Overall Rating and User Interest and Adoption.
Customers’ Choice Segment Distinction is used to distinguish vendors who are positioned in the upper-right quadrant of the segment quadrants.
The recognised vendors meet or surpass the segment’s average User Interest and Adoption as well as its average Overall Rating (see here for details).
View by Company Size Segment (by Annual Revenue)
Large Business (1B – 10B USD)
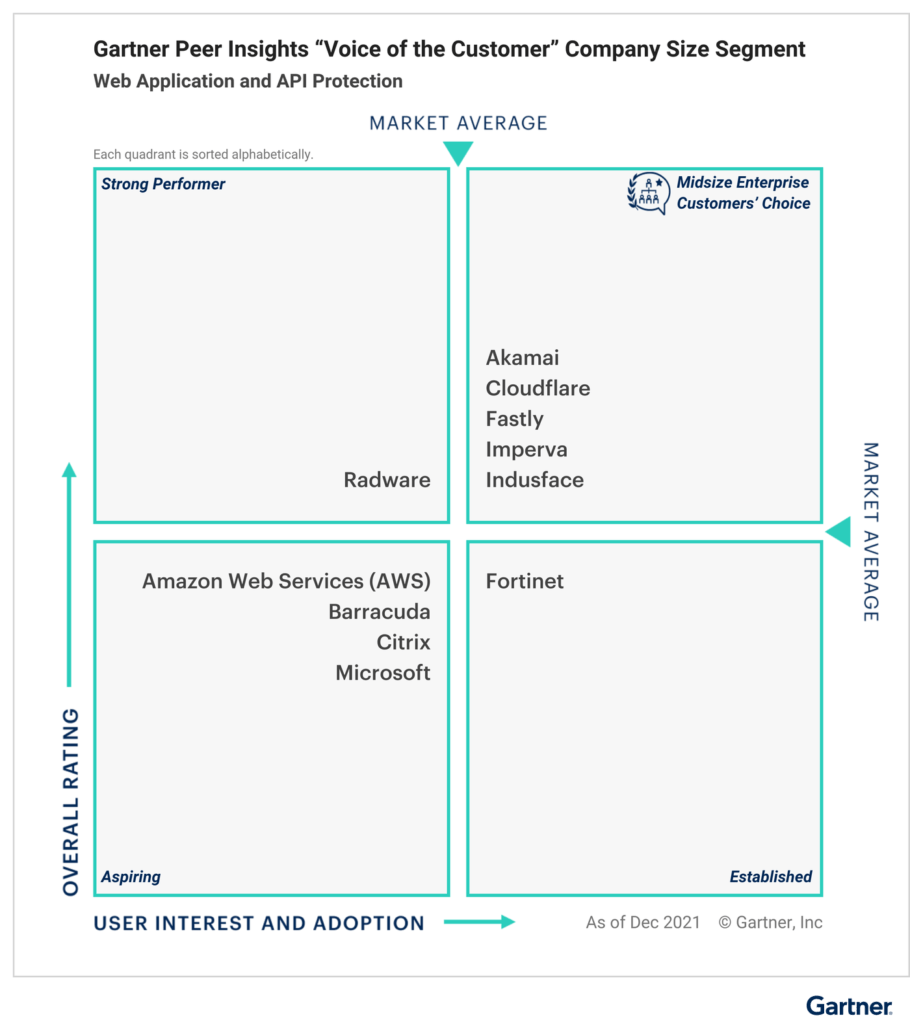
Midsize Business (50M – 1B USD)
View by Industry View by Services Deployment View by Region
Asia/Pacific
the Middle East, Africa, and Europe
The Americas
View by Company Size Segment (by Annual Revenue)
Industry Size Segment View
Deployment Region Segment View
Vendor summaries
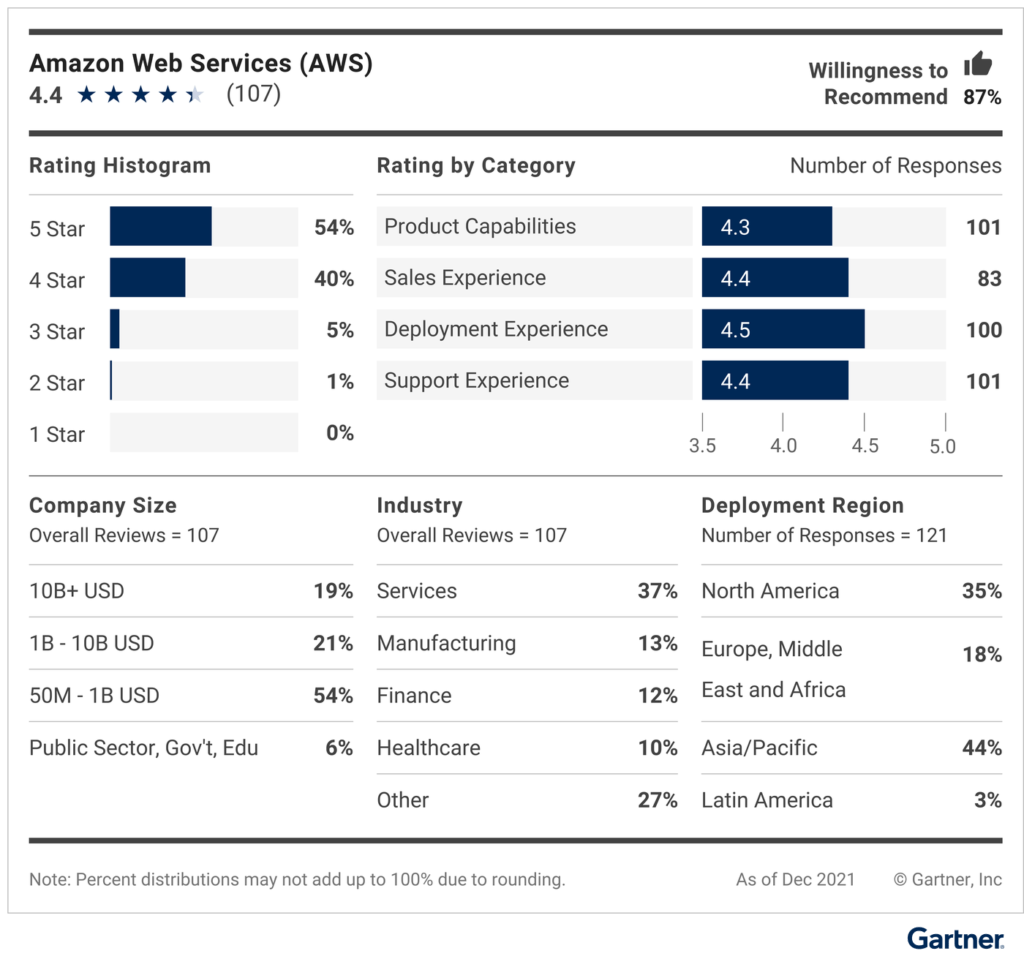
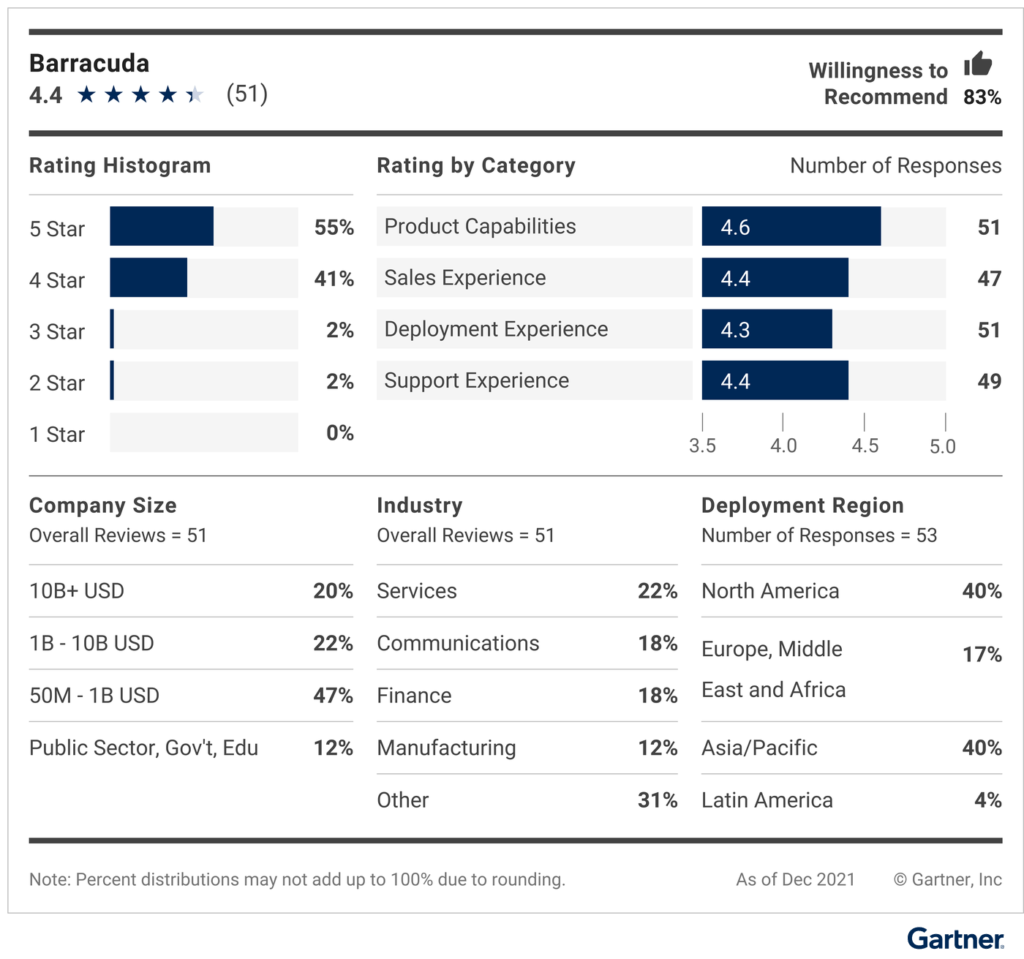
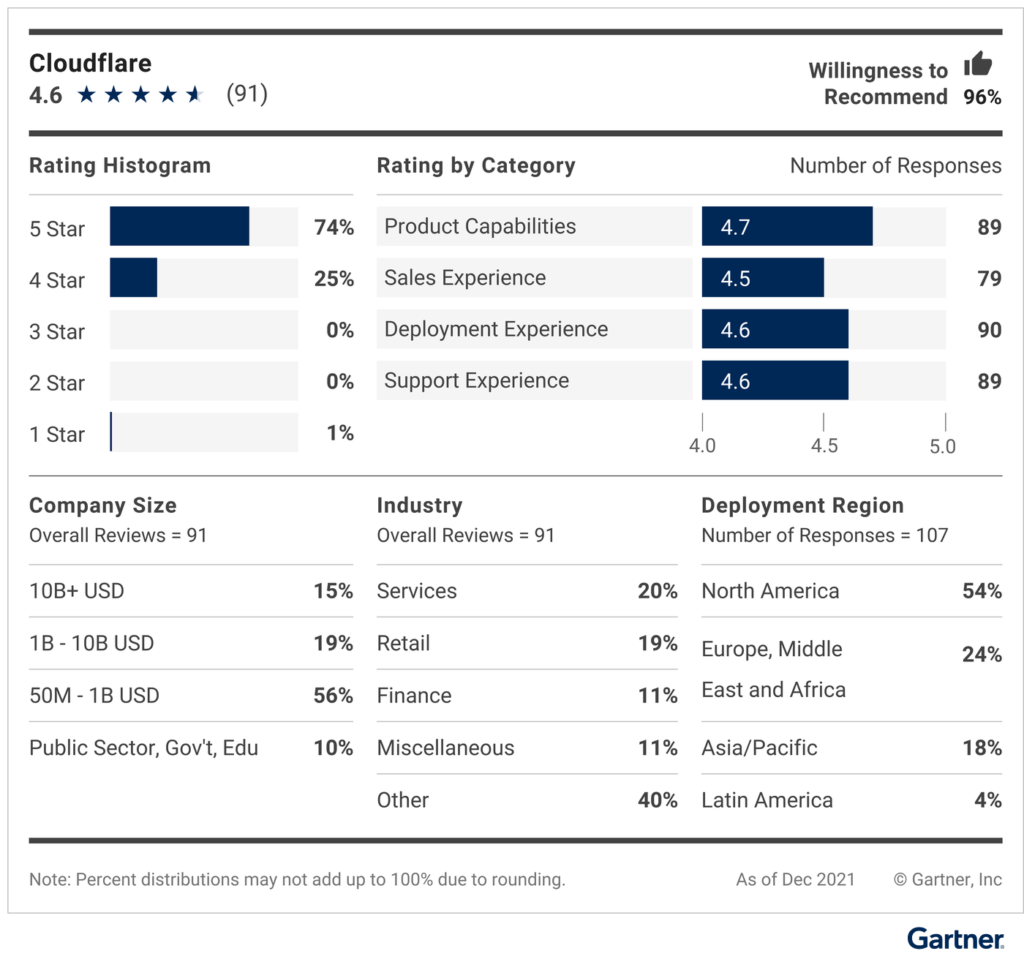
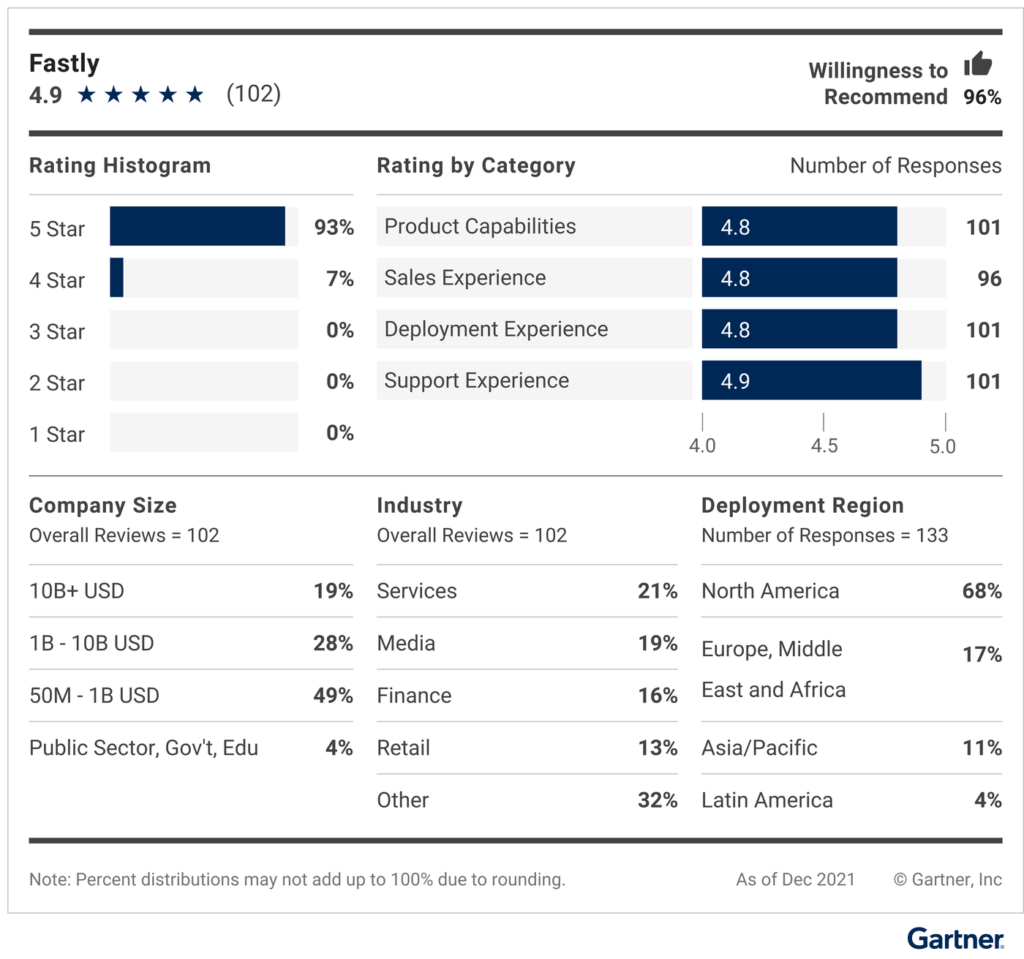
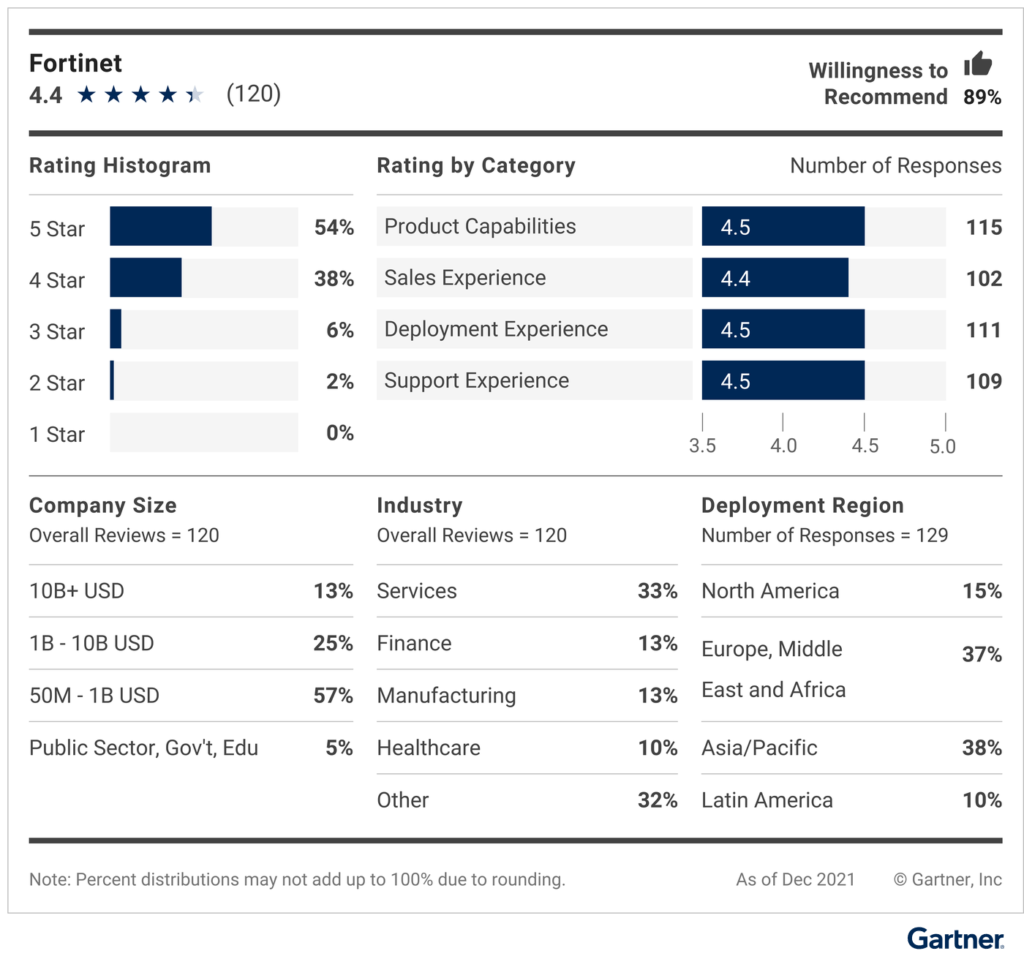
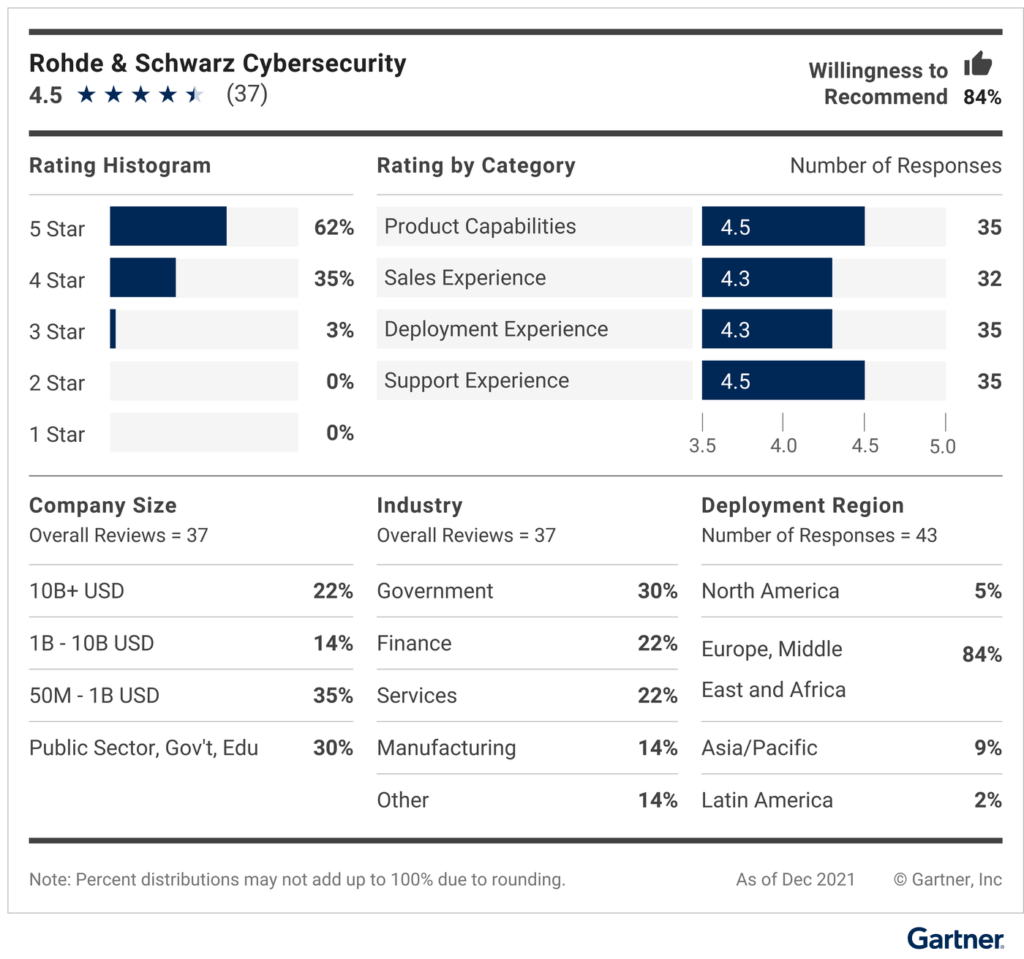
The key details for each vendor listed in the “Voice of the Customer” are summarised in Figures 10 through 23. These details include: reviewer demographics for reviews submitted during the 18-month review period, which ends on December 31, 2021; The overall rating, the distribution of ratings, and other ratings that address particular facets of the vendor experience. The ratings in the vendor summary figure, including the overall star rating, the willingness to recommend, and the rating by category, are subject to the same eligibility criteria and weighting as the “Voice of the Customer” quadrants (see methodology page here for details). There is a direct link to the user reviews on the Peer Insights website below each image.
Image 10. Web Application and API Protection: Gartner Peer Insights “Voice of the Customer” Vendor Summary


https://www.gartner.com/doc/reprints?id=1-29G58OHU&ct=220322&st=sb